How is your company faring when it comes to driver retention? Stay Metrics, now owned by Tenstreet, believes in sharing its retention knowledge to strengthen the industry and provides the Stay Days Table, which tracks carrier retention rates for newly hired drivers, and Turnover Report, each quarter.
2021 continues to offer challenges across industries and to the transportation and logistics sector. These tables and insights are meant to help you as you look to the future so you can overcome your challenges and keep drivers longer, whatever the industry throws at you.
Third Quarter Updated Reports
The Stay Days Table serves as a “survivor” chart tracking how long recently hired drivers are staying with their carriers, while the Turnover Report provides additional detail into driver employment trends among carriers. What does the data reveal this quarter?
To see enlarged versions of each chart, please click on the image.
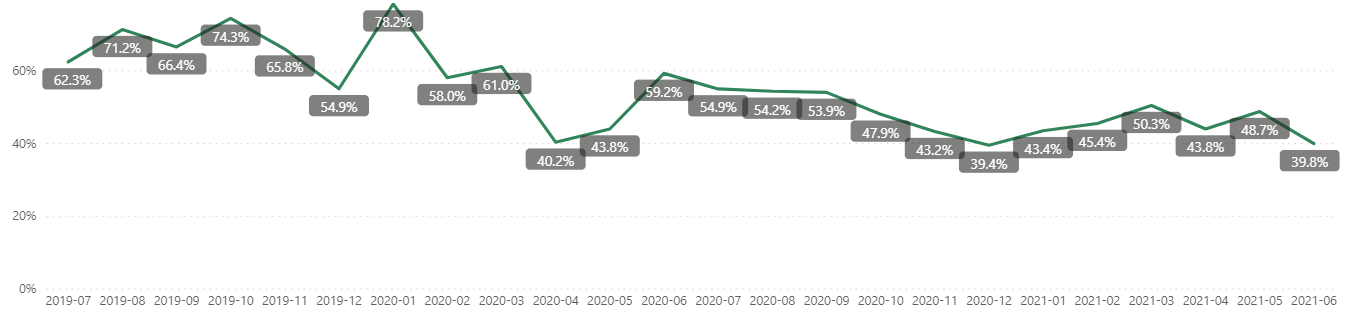
Monthly Annualized Driver Turnover
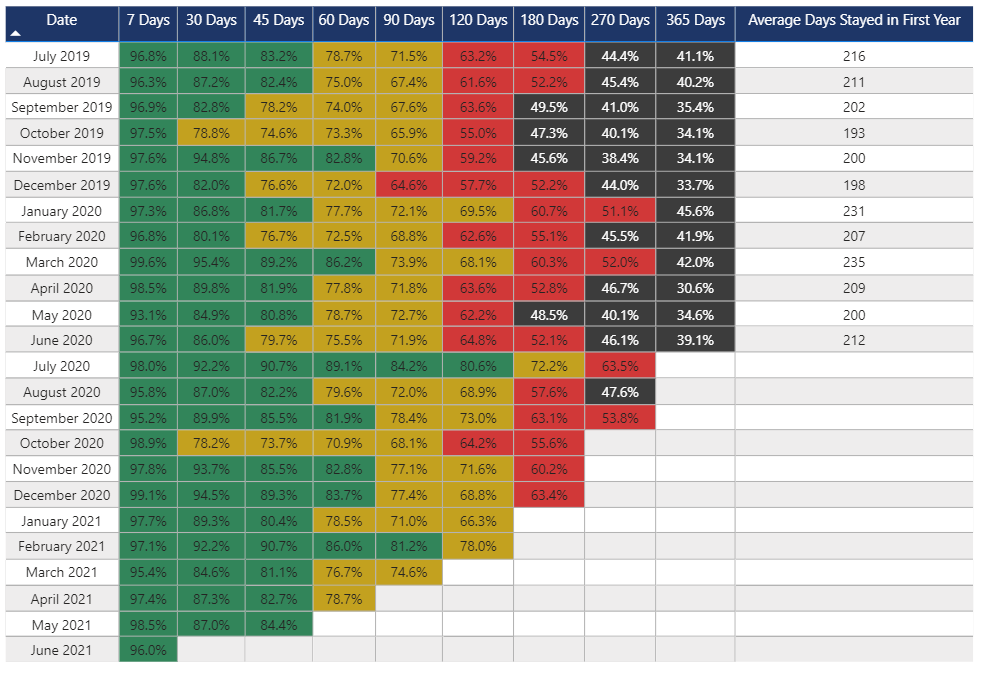
The Stay Days Table
- Turnover Instability Returns – Turnover was trending upward in the last quarterly update, showing three straight months with an increase in our last report. However, these numbers have since become much more volatile, with monthly annualized turnover seesawing in April, May, and June. This is likely due to the changing nature of the pandemic’s impact on various types of trucking companies and drivers not knowing what the future holds.
- Newly Hired Driver Retention Rates Are Stabilizing – Interestingly, the Stay Days Table indicates that carrier retention rates for recently hired drivers are smoothing out. For 7-day retention rates, the range between the high and low marks for the first six months of 2021 was 3.1 percentage points. This range is narrower compared to the prior two six-month periods. For July-December 2020 the gap between the high and low marks was almost 4 points, and for January-June 2020, the range was 6.5 points. When looking at 30-day retention rates, there is also a decrease in the variability, as there is only a 7.6 percentage point range for the first five months of 2021, compared to a range of more than 16 points for the last five months of 2020.
- Average Days Stayed in First Year Back to Previous Levels – January and March of 2020 saw the Average Days Stayed in First Year statistic jump significantly across carriers in our dataset, to over 230 days, likely due to the pandemic’s initial effects causing driver uncertainty. However, the April, May, and June 2020 numbers are now more in line with prior months.
As the vaccine rollout and the pandemic continue to impact both the nation and the world, Stay Metrics and Tenstreet are here to assist carriers. Contact us at [email protected] or 877-219-9283 to learn more about our products and services that can help you retain drivers and more.
Notes On Data: For this Q3, 2021 dataset, Stay Metrics (SM) chose to include data from 26 clients, based on their lengthy duration as clients and the quality of their data. For the analyses, data were aggregated to the client level, then averaged across clients. As this is based on SM clients, results could differ from the industry.