Stay Metrics, now a part of Tenstreet, is excited to provide additional insights into trends we are seeing through our data. Each quarter, we will share updated retention and turnover data, along with insights from our team of experts. This will be featured in two ways, through our Stay Days Table and our Driver Turnover Report.
Are you interested in learning more about our suite of tools that can help you retain drivers longer? Contact us today!
The Stay Days Table
Carrier Client Stay Days Table update – Q1 of 2021. See “notes on data” section for info.
Stay Metrics is focused on helping clients realize retention, not regrets. Our exclusive, and recently revamped, Stay Days Table can help the industry better understand trends in retention.
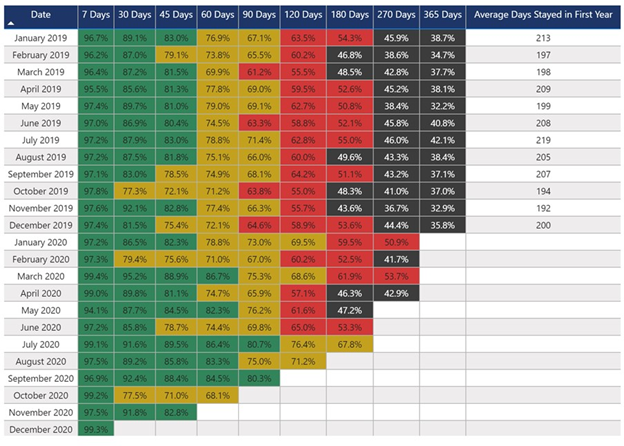
The Stay Days Table serves as a “survivor” chart tracking how long recently hired drivers are staying with their carriers. Our most recent update now shows data aggregated at the client level and then averaged across clients, so you can see how retention trends are developing across carrier clients for drivers hired each month.
This most recent update will be available to clients in late February.
Stay Metrics’ Take
The Onset of COVID-19: For drivers hired in March 2020, trends that had been seen related to higher retention rates in this month continued as we gathered more data. March 2020 has the highest retention rates for the 7 day, 30 day, 60 day, and 270 day milestones for any monthly data currently available for 2019-2020. This is likely due to the fact that these drivers started right when various industries in the country shut down causing great uncertainty throughout the country, which could have directly influenced their job behaviors longer term.
Ambiguity During the Pandemic: In subsequent months, as the country moved further into the pandemic, there is significant variability in retention rates. Confidence in the economy, health concerns, and other factors where public perception shifted back and forth likely played a role in this fluctuation in retention.
Signs of a Return to Normalcy: Now looking at numbers for October and November of 2020, the early returns on retention rates are very similar to what was seen in October and November of 2019. This could be an indication that the country is returning to a sense of normalcy as it relates to freight transportation. It is a good sign that November was similarly strong compared to 2019, which aligns with how strong the holiday season typically is for trucking.
Early Retention Looking Up: 2020 showed higher retention rates for the 7 day milestone, with 5 different months at or above 99% (including as recently as December), compared to 2019, when the highest 7 day retention rate was 97.8%. This occurred despite the fact that the process for onboarding drivers changed significantly due to the pandemic.
Turnover Report
Carrier Client Turnover Report update – Q1 of 2021. See “Notes on Data” section for info.
Stay Metrics will now be releasing annualized turnover data on a quarterly basis, along with the Stay Days Table. This data will give further insight into the industry regarding driver employment trends to help you benchmark against others. Similar to the Stay Days Table, this data is also aggregated at the client level first, and then averaged across clients.
Stay Metrics’ Take
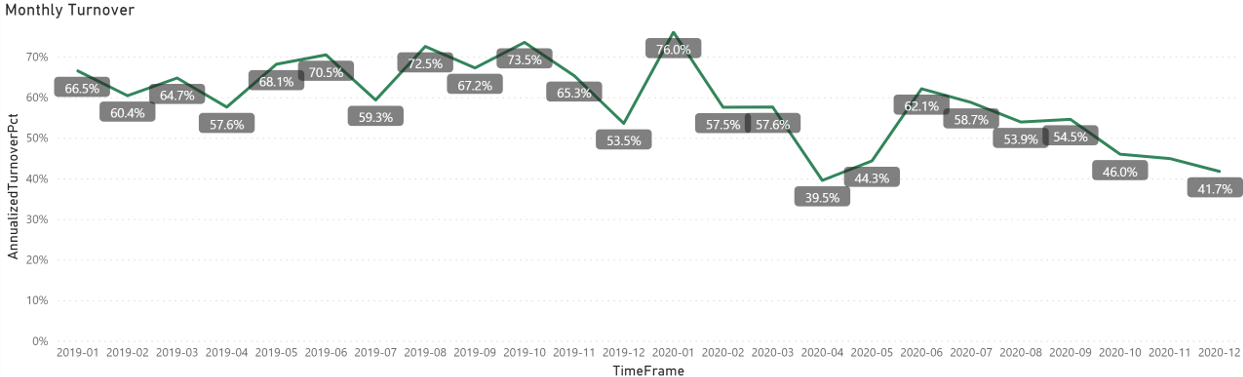
2020 Sees Big Increase In Variability In Turnover: Calendar year 2019 saw a range of 20 points for annualized monthly turnover, with a high of 73.5% and a low of 53.5%, but the range increased to over 36 points for calendar year 2020. April of 2020 saw a particularly large dip in the annualized turnover rate, as fears around the pandemic were at their height.
Turnover Trending Downward: Despite the fact that turnover is trending downward, going from 62.1% in June to 41.7% in December, companies are still feeling a lot of pressure to find new drivers, likely due, as CCJ reports, to the low influx of new-to-the-industry drivers, caused by driver school closings or reduced class sizes.
Vaccine Rollout: As the vaccine rollout continues and ramps up, this could cause an increase in freight volume, when businesses in industries like dining and entertainment can return to normal, and pent-up demand to enjoy these activities is unleashed. As such, the number of new drivers entering the market will be crucial to keeping up with freight demand, as will retaining experienced drivers.
Notes On Data
For this Q1, 2021 dataset, Stay Metrics (SM) chose to include data from 30 clients, based on their lengthy duration as clients and the quality of their data. For the analyses, data were aggregated to the client level, then averaged across clients. As this is based on SM clients, results could differ from the industry.
Tenstreet
Since 2006, Tenstreet has helped thousands of carriers and private fleets to market, recruit, onboard, manage and retain drivers and is the industry-leading software platform in the transportation space. Tenstreet creates web-based software that helps trucking companies by saving them time, money, and effort. Our services connect these companies and the drivers who work for them in a more meaningful way.