Collecting driver feedback is one of the most effective ways of improving driver retention rates. Giving drivers an outlet for their feedback helps them to feel less alone on the road, and collecting these opinions helps carriers to identify areas they can improve to better satisfy drivers’ needs.
But not all survey data are created equal. It’s easy to look at a jumble of driver feedback and pick out the most frequently mentioned items as the most urgent place to start, but this isn’t always the best way to make an impact on retention rates. Humans aren’t entirely logical when they give their opinions, so the aspects of your business that generate the most gripes might not actually be the factors that force drivers out the door.
Insights, Tenstreet’s industry-leading driver survey tool, offers carriers a totally unique metric for analyzing their driver feedback that helps them to identify the driver-reported issues that actually contribute to driver departures: the Insights Index Rank. This metric, unique to Tenstreet’s data analysis and reporting, helps to assign “weighted importance” to driver feedback based on a driver’s level of commitment to his or her carrier. This means that not all feedback is treated equally, putting a focus on the issues that could actually affect driver retention.
Understanding Why Weighted Feedback Matters
To understand why a metric like the Insights Index Rank is valuable, let’s back up and unpack why not all feedback is created equal. As an example, imagine you require an elective surgery to get a knee replacement and you’re evaluating two different hospitals to decide where you want to get the procedure done. After conducting research and speaking to people you know who have gotten the same procedure, you learn the following:- Hospital A has amazing nursing care but terrible food.
- Hospital B has terrible nursing care but amazing food.
How the Insights Index Rank Works
Insights Index Ranks are calculated using both mean ranks and correlations to commitment. A Mean Rank is based on a simple average of drivers’ ratings of how well their carrier is performing on certain issues. Mean Rank is valuable as an overall estimator of your drivers’ opinions about how well you’re doing on these issues. Issues on which drivers think you are performing poorly would get a low rank and would be an area to work to improve. To assess commitment for the feedback carriers receive, we ask drivers two commitment questions on each survey – “Do you intend to stay with your carrier for a month?” and “Do you intend to stay with your carrier for a year?”. Drivers that answered no to these questions – indicating that they don’t intend to stay with their carriers for long – were given low commitment scores. Drivers that answered yes were given high commitment scores. Correlations to commitment indicate how important each issue is to the carrier’s drivers. The stronger the correlation, the more likely drivers are to leave if a carrier is performing poorly on an issue. Issues on which drivers think you are performing poorly, and that are more important to drivers (i.e., have stronger correlations to commitment), would get a low rank and would be a high-priority area to work to improve. Therefore, by using mean rank and correlation to commitment together in our calculations, we arrive at a ranking system for reported issues that gives carriers a clearer picture of where they can see the greatest gains when considering making changes.Seeing The Insights Index Rank In Action
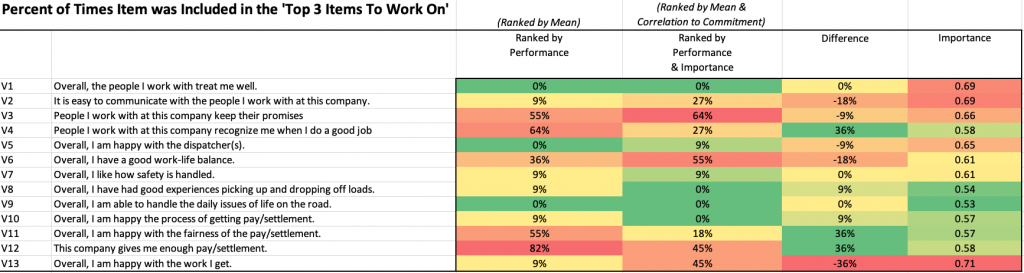
To see the Insights Index Rank in action, let’s look at a dataset of survey responses from real carriers on an Ongoing Experience survey, which assess driver satisfaction at regular intervals throughout a driver’s employment. The chart below details issues the carriers should work on, according to their drivers. The Ranked by Performance column is displaying the results based on the Mean Rank, and the Ranked by Performance and Importance column is displaying the results based on the Insights Index Rank.The percent in these columns indicate the percent of surveyed carriers that had the item show up in their top 3 items to work on. The Difference column highlights the percentage spread between the results in the Ranked by Performance and Ranked by Performance and Importance columns. The Importance column is the correlation to commitment described above; a measure of how much value drivers place on the issue addressed by a given question.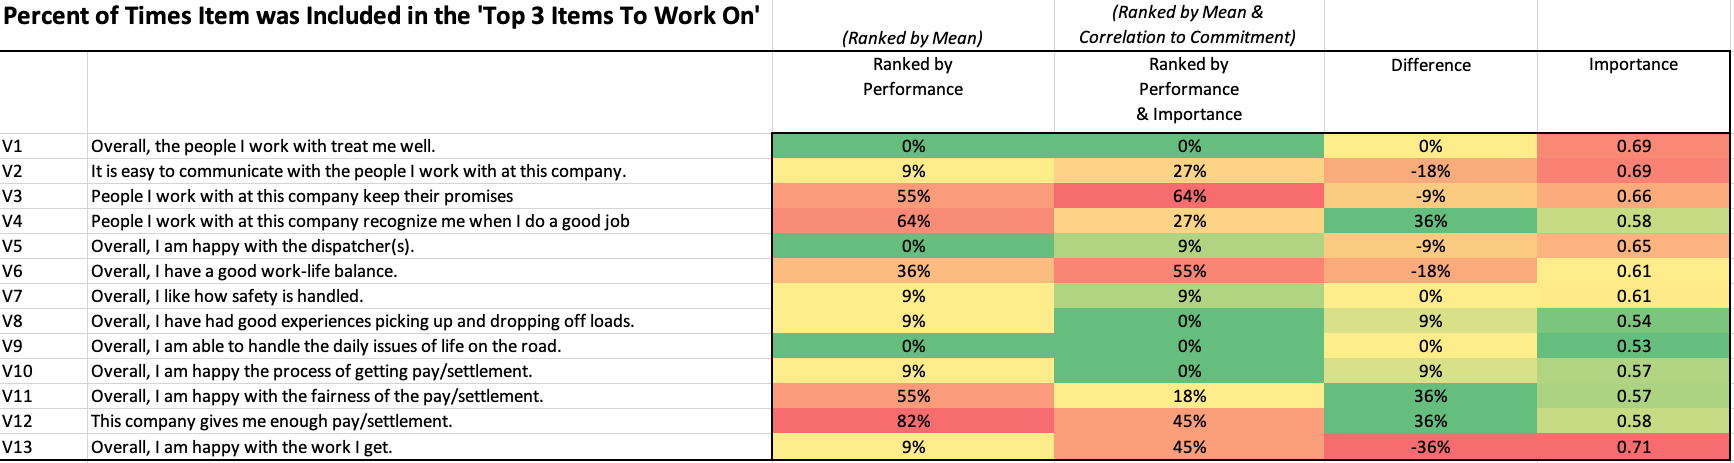
Click on the chart to see an enlarged image.
The Ranked by Performance column indicates that in routine check-ins with drivers over the course of their tenure with a carrier, the most frequently mentioned issues are dissatisfaction with the amount of pay (82%), lack of recognition at work (64%), employees not keeping their promises (55%), and the fairness of pay (55%). From this data, which is assessing driver feedback purely by frequency with which an issue is mentioned, we can conclude that for more tenured drivers, issues around pay arose frequently in complaints – likely because drivers who are more experienced have a stronger sense of their worth and what they should be making. Interpersonal issues come up often at this level as well. These findings indicate that feeling like a carrier is being honest and recognizing the skill of its employees remains important for long-term driver satisfaction. However, the Ranked by Performance and Importance column, which is rating issues based on the Insights Rank Index, offers a different perspective. The highest-ranking issues when driver commitment was factored in are employees not keeping their promises (64%), lack of work-life balance (55%), dissatisfaction with the amount of pay (45%), and dissatisfaction with the work a driver is given (45%). Pay is a frequently discussed topic in the world of retention and is often the reason blamed for a driver’s departure. While being paid well is still important in keeping skilled drivers for the long haul, pay dissatisfaction is less likely to be the actual tipping point that sends someone out the door. Promises being kept is the highest-ranked factor, suggesting that long-term drivers expect a high level of trust in their companies and feel highly dissatisfied when promises are not delivered on. Work-life balance and satisfaction with the work itself are highly ranked issues as well, indicating that drivers who are building a longer-term career in trucking need their jobs to be compatible with their lives. Money alone is not enough. Other interesting stats to note are a high incidence of drivers reporting feeling a lack of recognition, despite this being a less important factor, along with the increased importance of work satisfaction even though it shows up less often in drivers’ top 3 issue lists. These differences seem to suggest that while not feeling recognized can indicate to a driver that he isn’t valued, he is less likely to be bothered by this fact if the work itself satisfies him day-to-day.