A healthy interest in the driver market always ranks high on a carrier’s list. But given the tough conditions the industry has experienced over the last year, this interest has shifted to a furrowed concern. With application volumes dropping every week and more trucks sitting vacant, the desperation for drivers means carriers are likely paying more for less in an attempt to avoid the same fate other carriers and small businesses have suffered.
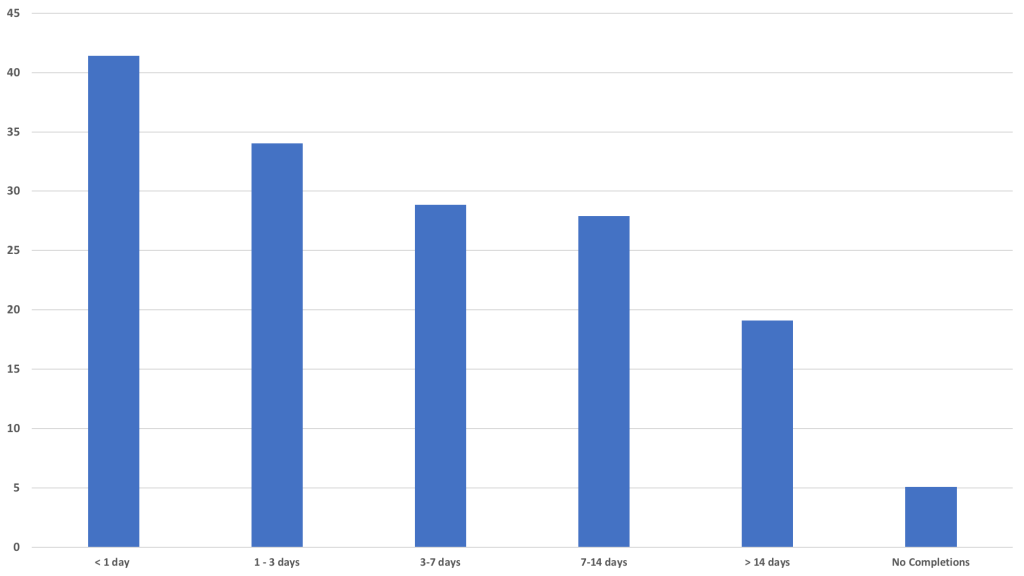
In addition to automation and integrations, engagement in early onboarding is another way you can improve your hiring cycle to improve your chances of getting that driver in a truck. The below chart shows carriers who engage drivers with text messaging, digital forms, and digital training modules within less than a day have a 40% greater chance of getting that driver all the way to hire.
Time and drivers aren’t the only things you’ll save. The more you can move online, the more money you save on hotels, meals, and recruiter onboarding time. Carriers who onboard online experienced an immediate 20%-40% in savings when they free their onboarding processes from expensive and unnecessary activities.
What’s Causing the Drop?
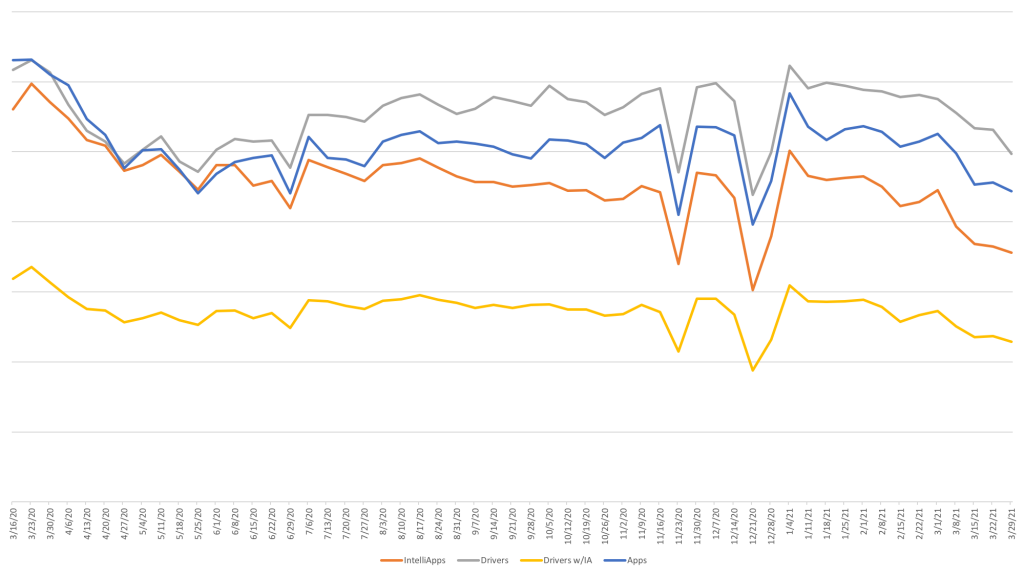
It’s a combination of several factors. Clearinghouse eliminations, retirements, and early exits would have affected the industry in 2020-21 anyway. But COVID introduced unprecedented factors to the market for which it couldn’t have prepared – notably drivers who are waiting to reenter the market (possibly until vaccination numbers rise or until they can get vaccinated) and the stimulus checks that keep them comfortable while they do so. The number one thing to remember is that you’re not alone. This is not a carrier- or service-specific shortcoming, it’s a broad drop in application volume that has impacted the entire industry. While that may bring you little comfort, there is something you can do to prepare for when drivers return. First, let’s review the data.Weekly Driver Activity – Last 53 Weeks
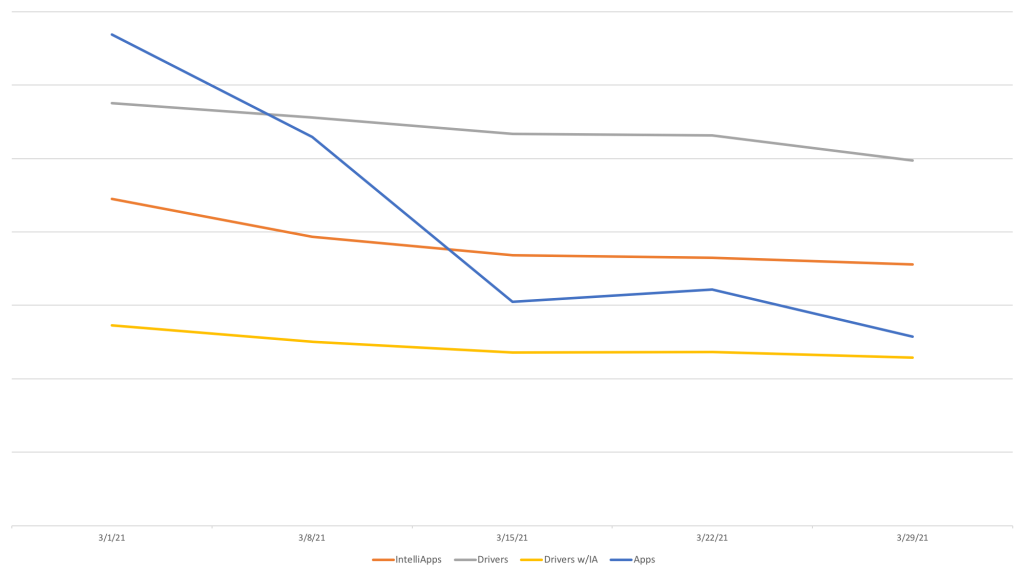
Typically, application rates tend to be high at the beginning of the year and during late spring/early summer. They gradually drop off until the holiday season, when the drop in the volume of applications tends to be most pronounced (see late November and December). Another case of seasonality explains the dip in February 2021 when the country was locked down by storms. From the first two charts below, you can see evidence of an additional market element. While driver job seeking activity is still significantly below pre-pandemic levels, the stimulus has managed to drop the floor out from under the situation. This is made clearer in the second chart, in which we’ve zoomed in on the last 5 weeks. Note the last 2-3 weeks in March where the number of applications fell drastically. March 2021 still places application volume 10 or 15 points below where we were in March 2020.
Weekly Driver Activity – Last 5 Weeks
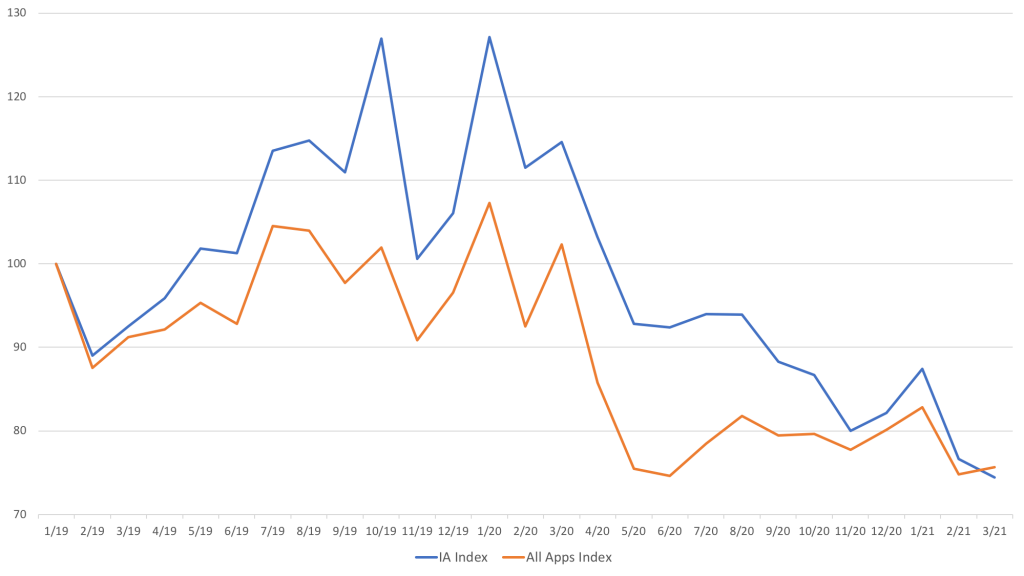
Application Activity Index
This index is derived from Tenstreet clients who have had a consistent IntelliApp volume for the past 25 months. We assigned January 2019 a value of 100 for comparison. This gives us an easy way to see rate of application activity change over the last two years while removing the impact of growth in the number of carriers using the platform. As you can see, carriers as a whole have seen a huge decline over the past year in general.
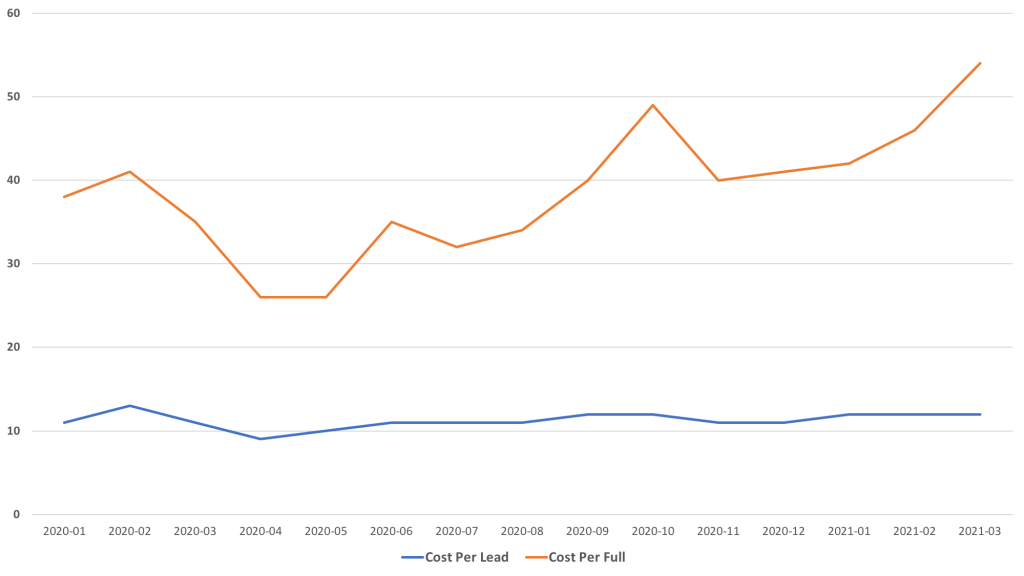
Cost Per Lead, Cost Per Full Application
As mentioned above, carriers are paying more for leads and full apps than they did just a year ago due to the more intensified driver shortage, and are likely finding that the more specific their search, the shorter their results fall. Nevertheless, cost per full application has risen +30% over the past year.
Hiring Cycle Compared to Hire Rate
This chart shows a solid inverse relationship between number of days in your cycle and the chance that a driver will make it to a hired status. Put simply, the longer your hiring process, the more opportunities there are for drivers to drop out. With carriers having to work harder for every candidate, it’s more important than ever that they be able to glide through your hiring process smoothly. As past data has shown, the more serious the candidate, the more carriers they are typically interacting with – so finding and eliminating any rough patches will pay dividends when the pendulum swings and application volume improves. This process need not be overwhelming, and we can help. Start by walking through your process as a driver and making note of any bottlenecks and hiccups. Replace them with time-saving solutions, like automation and integrations. Remember, drivers will be coming out of their own slumber and will not hesitate to move swiftly on to the next carrier if they encounter any reason to think they’re in store for more hard times.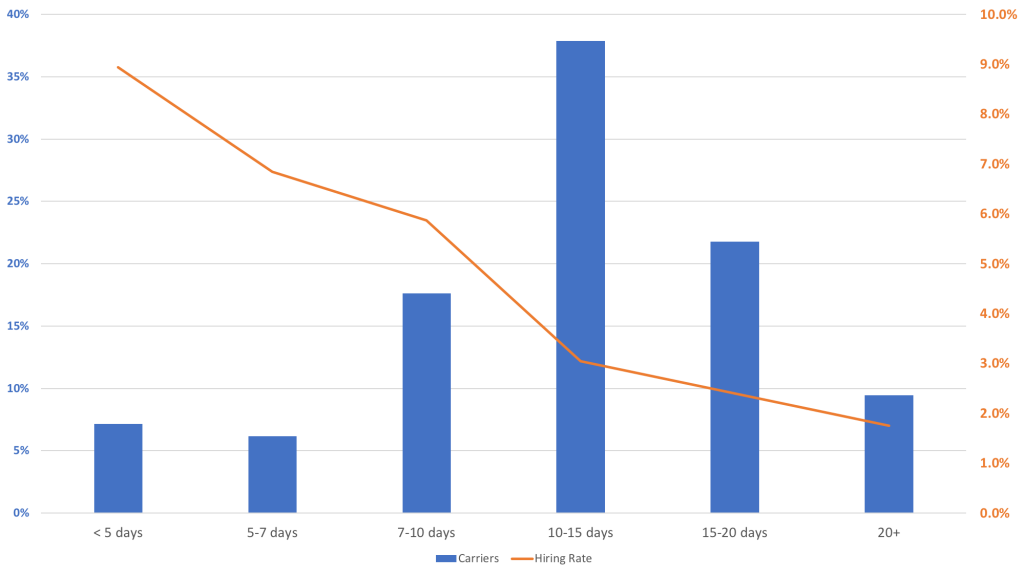 Engagement and Early Onboarding
In addition to automation and integrations, engagement in early onboarding is another way you can improve your hiring cycle to improve your chances of getting that driver in a truck. The below chart shows carriers who engage drivers with text messaging, digital forms, and digital training modules within less than a day have a 40% greater chance of getting that driver all the way to hire.
Time and drivers aren’t the only things you’ll save. The more you can move online, the more money you save on hotels, meals, and recruiter onboarding time. Carriers who onboard online experienced an immediate 20%-40% in savings when they free their onboarding processes from expensive and unnecessary activities.