The transportation industry is always changing. While the pandemic appears to be waning in the U.S., new issues bring challenges to both carriers and drivers. Covid outbreaks in China, high gas prices, the war in Ukraine, and lack of equipment availability continue to introduce turbulence to trucking at large.
Understanding what’s happening in the industry can help you and your carrier better prepare for change. The charts below shine light onto some key findings related to recruiting and retention that can help you keep drivers in your trucks for the long haul.
To see enlarged versions of a chart, click on its image.
 Overall, the number of drivers submitting IntelliApps has held extremely steady all year as well, hovering at just over 40,000 per week. Those drivers are reliably completing around 70,000 IntelliApps per week.
The total number of drivers submitting lead forms has slid between 85,000 and 100,000 drivers submitting applications per week, with a recent rise in these drivers starting in mid-March. This climb indicates signs of greater driver availability in the market.
The true variability comes in the number of leads being submitted per week, with nearly 280,000 leads rolling in the first week of 2022 and as few as 240,000 submissions occurring at the end of February.
What can we conclude from this information? The number of drivers interested in hearing about a new job (Leads Drivers), the number of drivers interested enough to apply to those jobs (IA drivers), and the number of applications they submit to those jobs are steady trends we don’t expect to see change drastically.
The greatest week-to-week variability comes from leads, meaning interest is variable even though application numbers are holding steady. More leads one week isn’t translating to an uptick in completed apps, so if your goal is to hire drivers, put a strong focus on identifying which lead sources net you the best IntelliApp conversions. Those are the sources that will actually help you make the hires you need.
Overall, the number of drivers submitting IntelliApps has held extremely steady all year as well, hovering at just over 40,000 per week. Those drivers are reliably completing around 70,000 IntelliApps per week.
The total number of drivers submitting lead forms has slid between 85,000 and 100,000 drivers submitting applications per week, with a recent rise in these drivers starting in mid-March. This climb indicates signs of greater driver availability in the market.
The true variability comes in the number of leads being submitted per week, with nearly 280,000 leads rolling in the first week of 2022 and as few as 240,000 submissions occurring at the end of February.
What can we conclude from this information? The number of drivers interested in hearing about a new job (Leads Drivers), the number of drivers interested enough to apply to those jobs (IA drivers), and the number of applications they submit to those jobs are steady trends we don’t expect to see change drastically.
The greatest week-to-week variability comes from leads, meaning interest is variable even though application numbers are holding steady. More leads one week isn’t translating to an uptick in completed apps, so if your goal is to hire drivers, put a strong focus on identifying which lead sources net you the best IntelliApp conversions. Those are the sources that will actually help you make the hires you need.
 The trend in this chart is obvious – the faster a recruiter is able to reach out to a driver after he or she has submitted an application, the more likely the driver is to come to work for that carrier. Every minute counts when a driver is serious enough about changing jobs to submit applications – give that driver an hour and he’ll have already submitted applications to a few other carriers and be less likely to return your calls. But if you reach him in less than 5 minutes, you’ll still be on his mind and more likely to attract him.
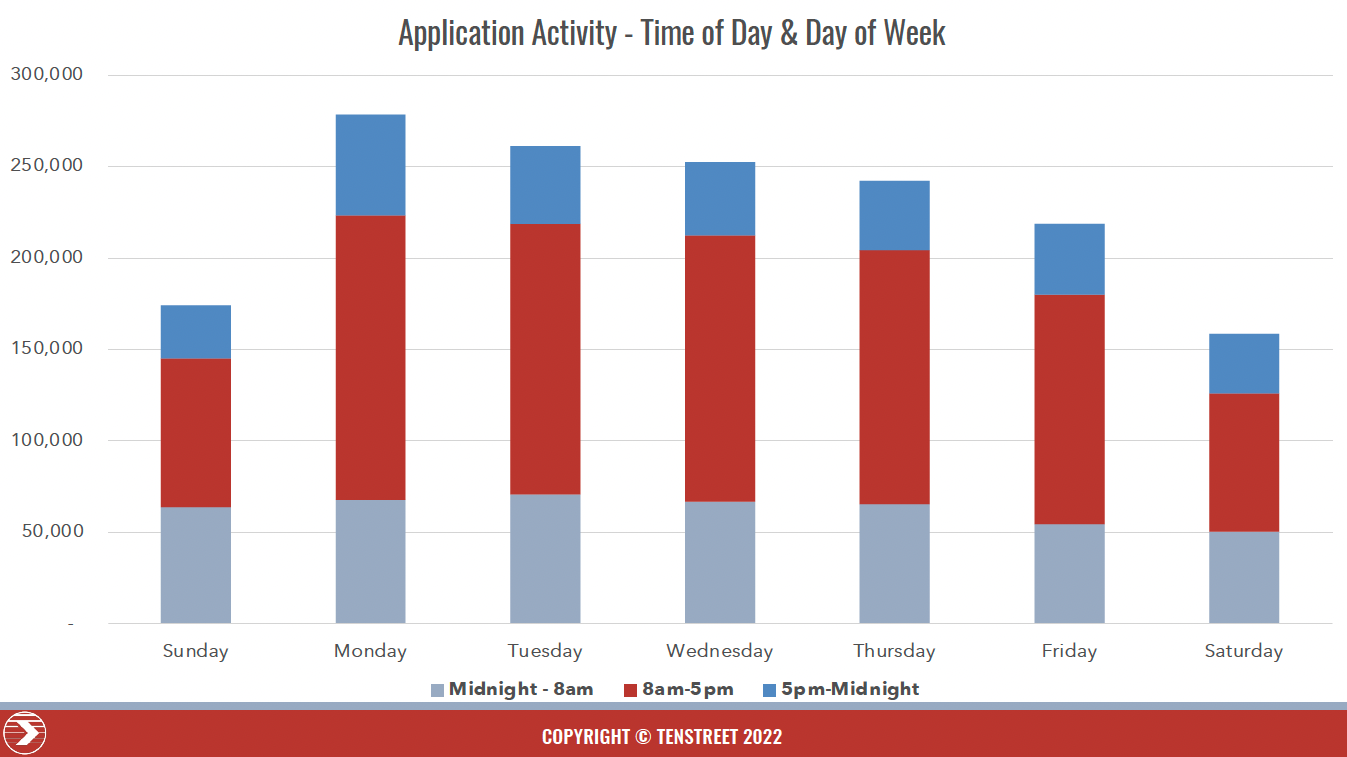
The chart below shows the times of day and days of the week that drivers submit applications.
The trend in this chart is obvious – the faster a recruiter is able to reach out to a driver after he or she has submitted an application, the more likely the driver is to come to work for that carrier. Every minute counts when a driver is serious enough about changing jobs to submit applications – give that driver an hour and he’ll have already submitted applications to a few other carriers and be less likely to return your calls. But if you reach him in less than 5 minutes, you’ll still be on his mind and more likely to attract him.
The chart below shows the times of day and days of the week that drivers submit applications.
 While the majority of driver applications come during the traditional 8am-5pm workday, in reality this time window only accounts for about half of driver applications on a given day – the other half come later at night (5pm-Midnight) or early in the morning (Midnight-8am). If your recruiters are only working 8am-5pm, they are missing out on the opportunity to reach drivers in minutes for as many as half their applications. Carriers can make themselves more competitive by creating coverage plans or automated responses for after-hours applications so those drivers stay engaged when they apply.
A speedy response time helps hook a driver, but being able to bring that applicant onboard quickly matters too, as the “Days Matter” chart demonstrates below.
While the majority of driver applications come during the traditional 8am-5pm workday, in reality this time window only accounts for about half of driver applications on a given day – the other half come later at night (5pm-Midnight) or early in the morning (Midnight-8am). If your recruiters are only working 8am-5pm, they are missing out on the opportunity to reach drivers in minutes for as many as half their applications. Carriers can make themselves more competitive by creating coverage plans or automated responses for after-hours applications so those drivers stay engaged when they apply.
A speedy response time helps hook a driver, but being able to bring that applicant onboard quickly matters too, as the “Days Matter” chart demonstrates below.
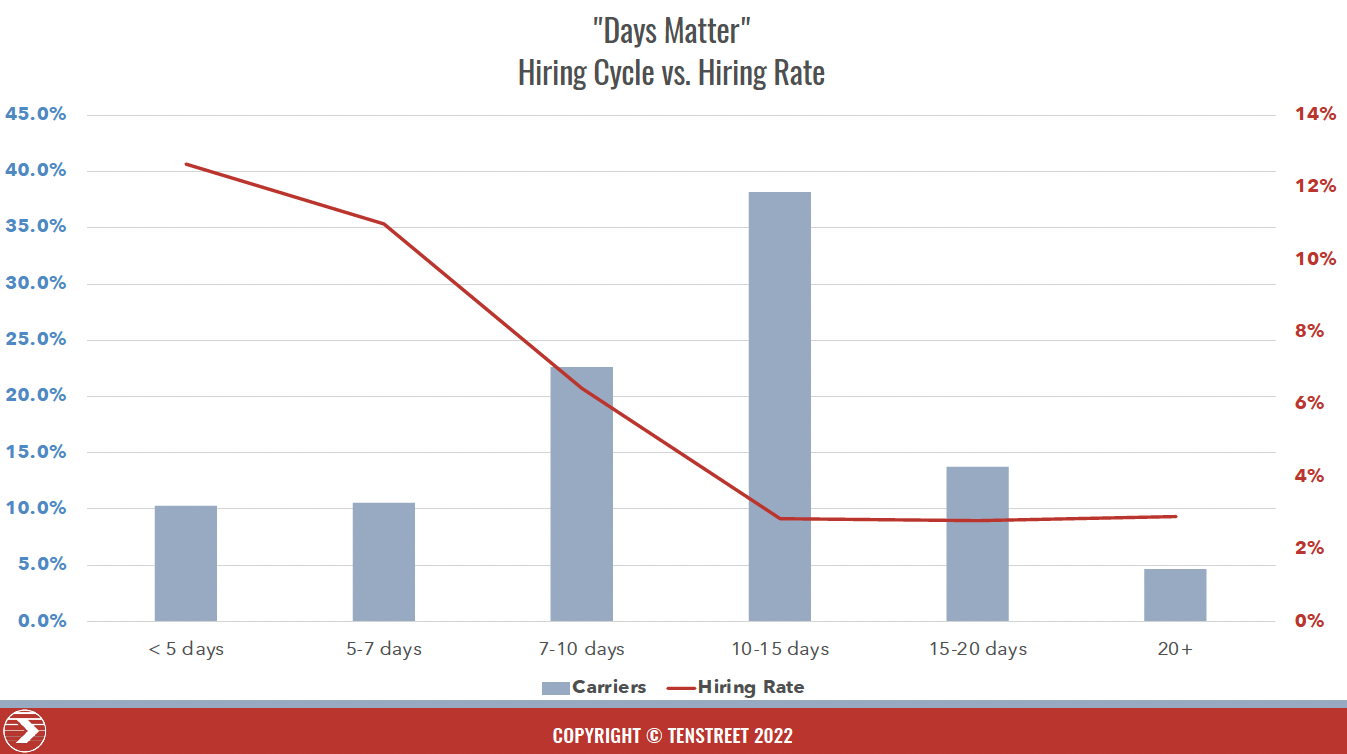
 The left vertical axis of this chart shows the percentage of carriers that has a given hiring cycle length, from fewer than 5 days to more than 20 days. The right vertical axis and its corresponding Hiring Rate line show the percent likelihood of each carrier to complete a hire based on the duration of their hiring cycle.
The findings here show that a carrier is more likely to hire a driver if they can formalize that hire quickly. Even though the majority of carriers have a 10-15 day hiring cycle, they are far from having the highest hire rate, with less than 4% of these applicants ending up filling a seat. Carriers with a hiring cycle that’s 5 days or fewer see hiring rates of more than 12% – a huge return on investment for applications netted. Carriers that can shave days off their hiring cycle, giving drivers an easy-to-navigate process when they’re looking to change jobs, are exponentially more likely to make the hire.
The left vertical axis of this chart shows the percentage of carriers that has a given hiring cycle length, from fewer than 5 days to more than 20 days. The right vertical axis and its corresponding Hiring Rate line show the percent likelihood of each carrier to complete a hire based on the duration of their hiring cycle.
The findings here show that a carrier is more likely to hire a driver if they can formalize that hire quickly. Even though the majority of carriers have a 10-15 day hiring cycle, they are far from having the highest hire rate, with less than 4% of these applicants ending up filling a seat. Carriers with a hiring cycle that’s 5 days or fewer see hiring rates of more than 12% – a huge return on investment for applications netted. Carriers that can shave days off their hiring cycle, giving drivers an easy-to-navigate process when they’re looking to change jobs, are exponentially more likely to make the hire.
 The data for 2022 so far indicates that the turnover rate is ticking back up after a steady downward trend in monthly annualized turnover since July 2021.
After bottoming out in January, turnover has climbed by over 10 percentage points from January to March, which appears to be at least partly driven by the seasonality of the driver hiring market. June 2020 to March 2021 saw a very similar trend in turnover, indicating a noted trend in the transportation industry where drivers look to change jobs at the start of a new year (a trend that’s further supported by the above YTD Driver Market Activity chart, which shows an all-time high lead submission rate for 2022 the week of January 3).
The Stay Days Table serves as a “survivor” chart tracking how long recently hired drivers are staying with their carriers.
The data for 2022 so far indicates that the turnover rate is ticking back up after a steady downward trend in monthly annualized turnover since July 2021.
After bottoming out in January, turnover has climbed by over 10 percentage points from January to March, which appears to be at least partly driven by the seasonality of the driver hiring market. June 2020 to March 2021 saw a very similar trend in turnover, indicating a noted trend in the transportation industry where drivers look to change jobs at the start of a new year (a trend that’s further supported by the above YTD Driver Market Activity chart, which shows an all-time high lead submission rate for 2022 the week of January 3).
The Stay Days Table serves as a “survivor” chart tracking how long recently hired drivers are staying with their carriers.
 Interestingly, the Stay Days Table does not show a decrease in short-term retention for new-to-you drivers despite the overall decrease in retention rates. Retention rates for new drivers remain steady, suggesting that more tenured drivers are the ones choosing to leave their carriers, either due to retirement, dissatisfaction with the industry, or to switch to another carrier.
Recruiting: State of the Market
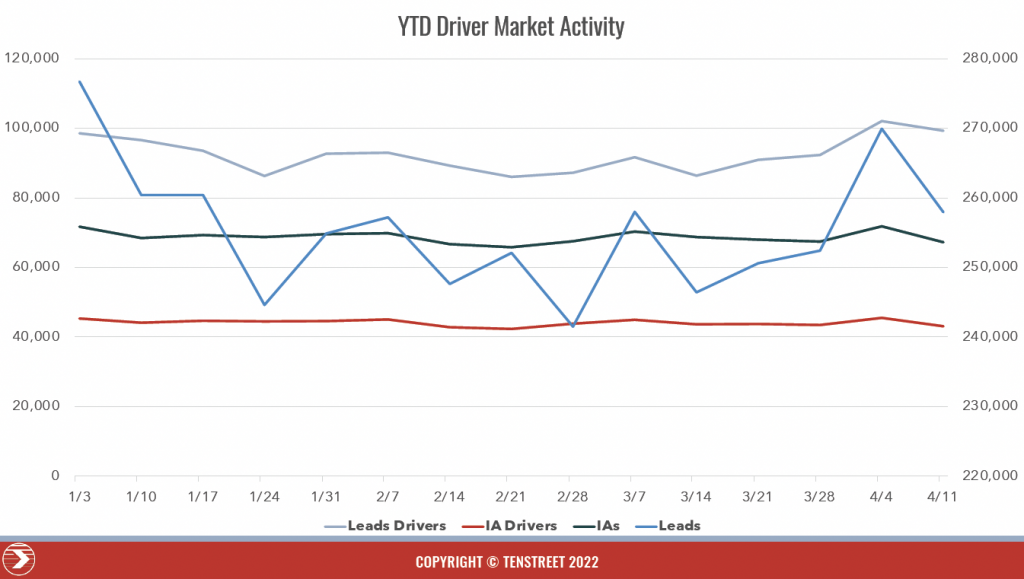
The YTD Driver Market Activity graph below tells the overall story of driver applicant and application behavior for 2022 through mid-April. The left vertical axis corresponds with the number of drivers filling out lead forms (Leads Drivers), the number of drivers submitting IntelliApps (IA Drivers) each week, and the total number of IntelliApps submitted (IAs) per week. The right vertical axis is mapped to the total number of leads submitted (Leads) by those drivers per week. Overall, the number of drivers submitting IntelliApps has held extremely steady all year as well, hovering at just over 40,000 per week. Those drivers are reliably completing around 70,000 IntelliApps per week.
The total number of drivers submitting lead forms has slid between 85,000 and 100,000 drivers submitting applications per week, with a recent rise in these drivers starting in mid-March. This climb indicates signs of greater driver availability in the market.
The true variability comes in the number of leads being submitted per week, with nearly 280,000 leads rolling in the first week of 2022 and as few as 240,000 submissions occurring at the end of February.
What can we conclude from this information? The number of drivers interested in hearing about a new job (Leads Drivers), the number of drivers interested enough to apply to those jobs (IA drivers), and the number of applications they submit to those jobs are steady trends we don’t expect to see change drastically.
The greatest week-to-week variability comes from leads, meaning interest is variable even though application numbers are holding steady. More leads one week isn’t translating to an uptick in completed apps, so if your goal is to hire drivers, put a strong focus on identifying which lead sources net you the best IntelliApp conversions. Those are the sources that will actually help you make the hires you need.
Overall, the number of drivers submitting IntelliApps has held extremely steady all year as well, hovering at just over 40,000 per week. Those drivers are reliably completing around 70,000 IntelliApps per week.
The total number of drivers submitting lead forms has slid between 85,000 and 100,000 drivers submitting applications per week, with a recent rise in these drivers starting in mid-March. This climb indicates signs of greater driver availability in the market.
The true variability comes in the number of leads being submitted per week, with nearly 280,000 leads rolling in the first week of 2022 and as few as 240,000 submissions occurring at the end of February.
What can we conclude from this information? The number of drivers interested in hearing about a new job (Leads Drivers), the number of drivers interested enough to apply to those jobs (IA drivers), and the number of applications they submit to those jobs are steady trends we don’t expect to see change drastically.
The greatest week-to-week variability comes from leads, meaning interest is variable even though application numbers are holding steady. More leads one week isn’t translating to an uptick in completed apps, so if your goal is to hire drivers, put a strong focus on identifying which lead sources net you the best IntelliApp conversions. Those are the sources that will actually help you make the hires you need.
Important Application Response Trends
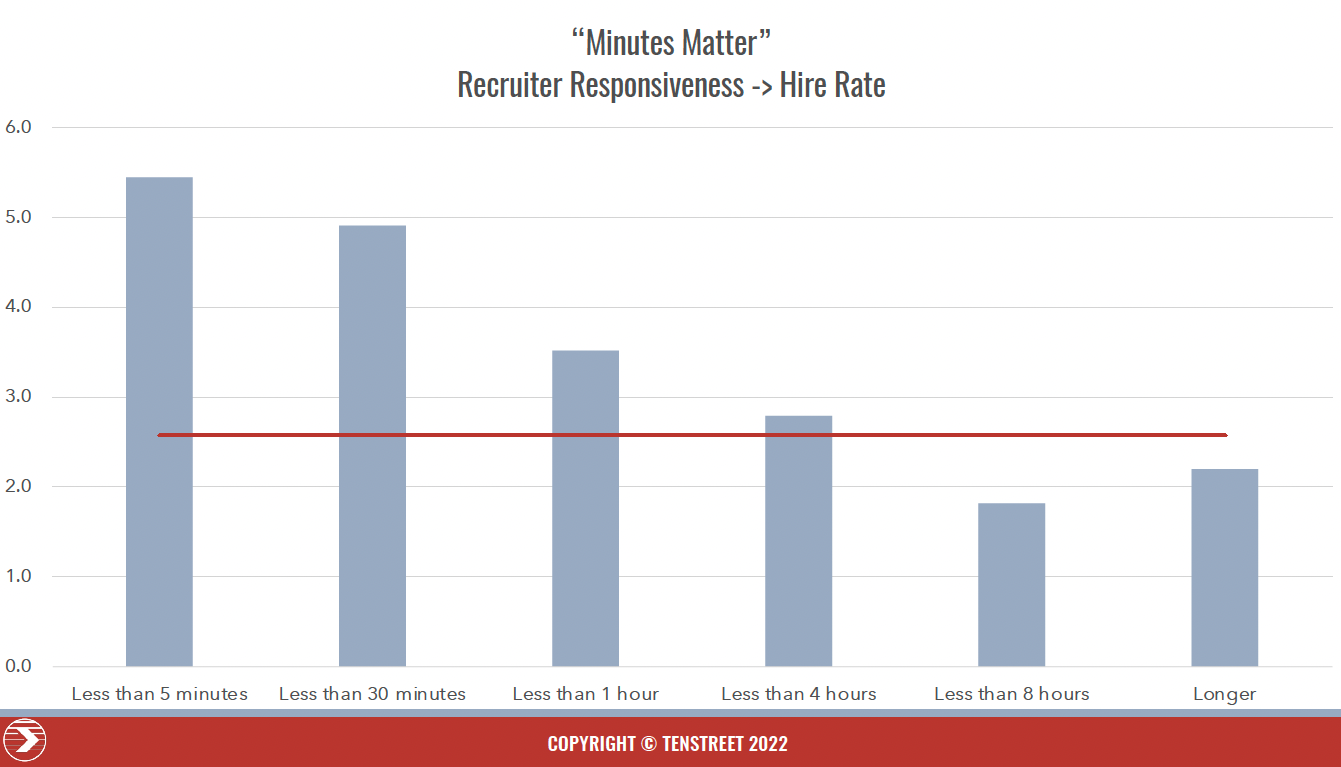
Understanding driver motivations after an application is submitted makes a big difference in being able to harness the interest of your job candidates. The “Minutes Matter” chart below demonstrates the likelihood of a driver hire based on how long it takes a recruiter to respond to that driver’s application. The red horizontal line represents the average hiring rate per quarter overall for carriers (around 2.5 hires last quarter). The bar charts compare the number of hires per month based on response time.
The trend in this chart is obvious – the faster a recruiter is able to reach out to a driver after he or she has submitted an application, the more likely the driver is to come to work for that carrier. Every minute counts when a driver is serious enough about changing jobs to submit applications – give that driver an hour and he’ll have already submitted applications to a few other carriers and be less likely to return your calls. But if you reach him in less than 5 minutes, you’ll still be on his mind and more likely to attract him.
The chart below shows the times of day and days of the week that drivers submit applications.
 While the majority of driver applications come during the traditional 8am-5pm workday, in reality this time window only accounts for about half of driver applications on a given day – the other half come later at night (5pm-Midnight) or early in the morning (Midnight-8am). If your recruiters are only working 8am-5pm, they are missing out on the opportunity to reach drivers in minutes for as many as half their applications. Carriers can make themselves more competitive by creating coverage plans or automated responses for after-hours applications so those drivers stay engaged when they apply.
A speedy response time helps hook a driver, but being able to bring that applicant onboard quickly matters too, as the “Days Matter” chart demonstrates below.
While the majority of driver applications come during the traditional 8am-5pm workday, in reality this time window only accounts for about half of driver applications on a given day – the other half come later at night (5pm-Midnight) or early in the morning (Midnight-8am). If your recruiters are only working 8am-5pm, they are missing out on the opportunity to reach drivers in minutes for as many as half their applications. Carriers can make themselves more competitive by creating coverage plans or automated responses for after-hours applications so those drivers stay engaged when they apply.
A speedy response time helps hook a driver, but being able to bring that applicant onboard quickly matters too, as the “Days Matter” chart demonstrates below.
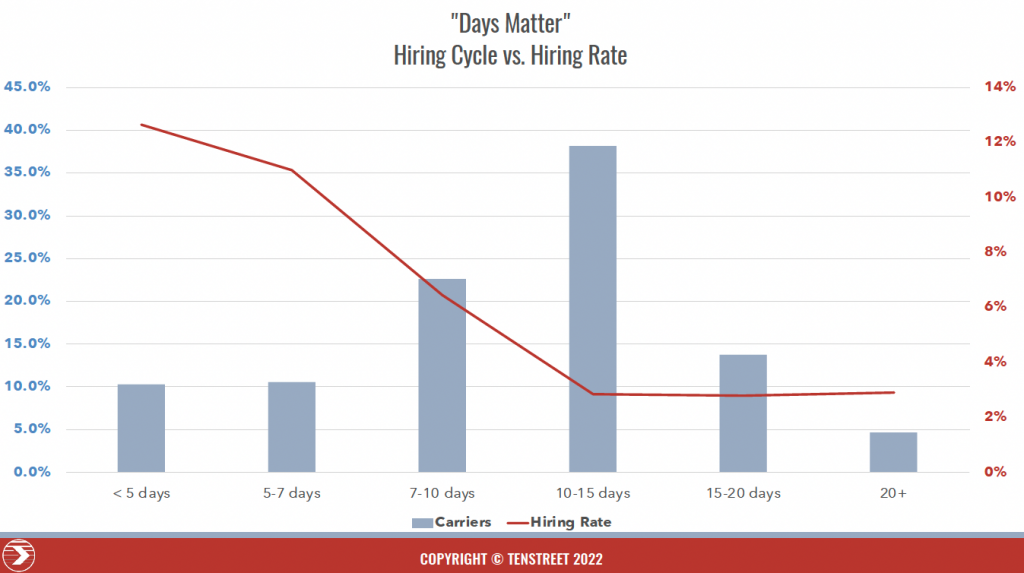
 The left vertical axis of this chart shows the percentage of carriers that has a given hiring cycle length, from fewer than 5 days to more than 20 days. The right vertical axis and its corresponding Hiring Rate line show the percent likelihood of each carrier to complete a hire based on the duration of their hiring cycle.
The findings here show that a carrier is more likely to hire a driver if they can formalize that hire quickly. Even though the majority of carriers have a 10-15 day hiring cycle, they are far from having the highest hire rate, with less than 4% of these applicants ending up filling a seat. Carriers with a hiring cycle that’s 5 days or fewer see hiring rates of more than 12% – a huge return on investment for applications netted. Carriers that can shave days off their hiring cycle, giving drivers an easy-to-navigate process when they’re looking to change jobs, are exponentially more likely to make the hire.
The left vertical axis of this chart shows the percentage of carriers that has a given hiring cycle length, from fewer than 5 days to more than 20 days. The right vertical axis and its corresponding Hiring Rate line show the percent likelihood of each carrier to complete a hire based on the duration of their hiring cycle.
The findings here show that a carrier is more likely to hire a driver if they can formalize that hire quickly. Even though the majority of carriers have a 10-15 day hiring cycle, they are far from having the highest hire rate, with less than 4% of these applicants ending up filling a seat. Carriers with a hiring cycle that’s 5 days or fewer see hiring rates of more than 12% – a huge return on investment for applications netted. Carriers that can shave days off their hiring cycle, giving drivers an easy-to-navigate process when they’re looking to change jobs, are exponentially more likely to make the hire.
Retention: Turnover in Trucking Outlook
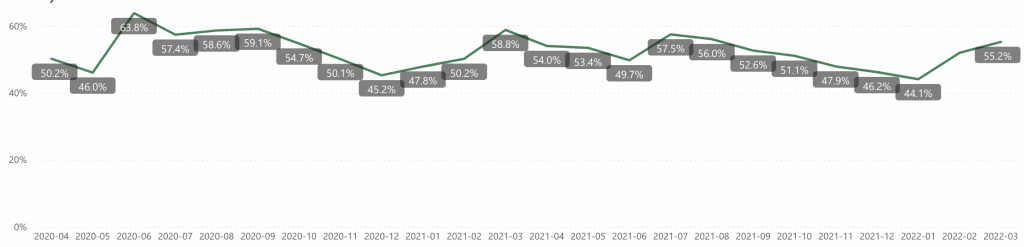
Displayed below are our quarterly Stay Days Table and Turnover reports, which highlight the trends we’ve been seeing in driver retention behavior once they’re hired at a carrier. The Monthly Annualized Driver Turnover chart provides detail into driver employment trends among carriers.Monthly Annualized Driver Turnover
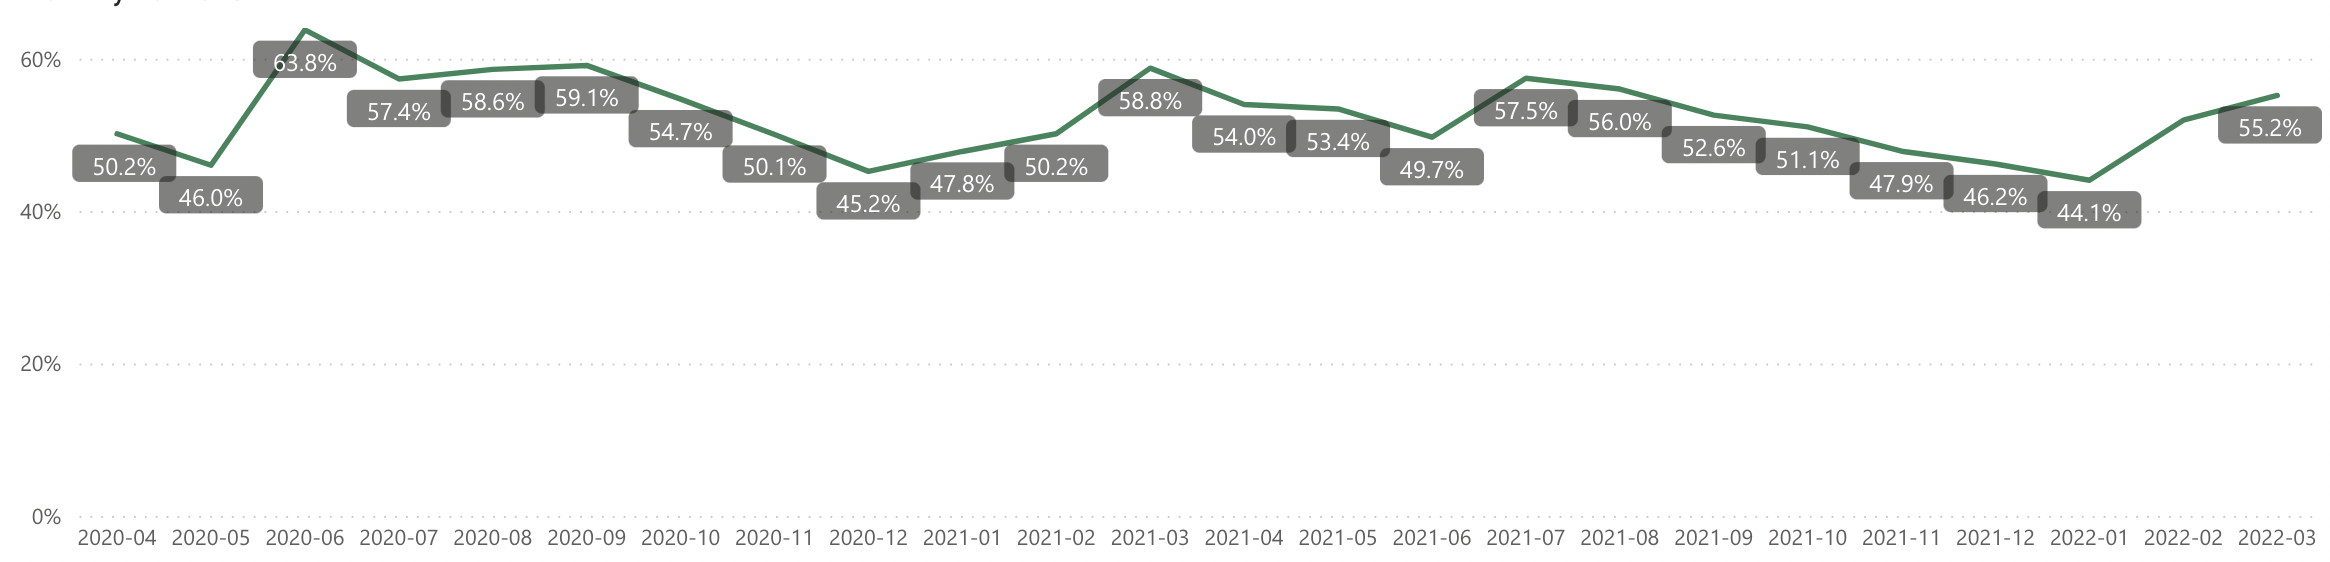 The data for 2022 so far indicates that the turnover rate is ticking back up after a steady downward trend in monthly annualized turnover since July 2021.
After bottoming out in January, turnover has climbed by over 10 percentage points from January to March, which appears to be at least partly driven by the seasonality of the driver hiring market. June 2020 to March 2021 saw a very similar trend in turnover, indicating a noted trend in the transportation industry where drivers look to change jobs at the start of a new year (a trend that’s further supported by the above YTD Driver Market Activity chart, which shows an all-time high lead submission rate for 2022 the week of January 3).
The Stay Days Table serves as a “survivor” chart tracking how long recently hired drivers are staying with their carriers.
The data for 2022 so far indicates that the turnover rate is ticking back up after a steady downward trend in monthly annualized turnover since July 2021.
After bottoming out in January, turnover has climbed by over 10 percentage points from January to March, which appears to be at least partly driven by the seasonality of the driver hiring market. June 2020 to March 2021 saw a very similar trend in turnover, indicating a noted trend in the transportation industry where drivers look to change jobs at the start of a new year (a trend that’s further supported by the above YTD Driver Market Activity chart, which shows an all-time high lead submission rate for 2022 the week of January 3).
The Stay Days Table serves as a “survivor” chart tracking how long recently hired drivers are staying with their carriers.
The Stay Days Table
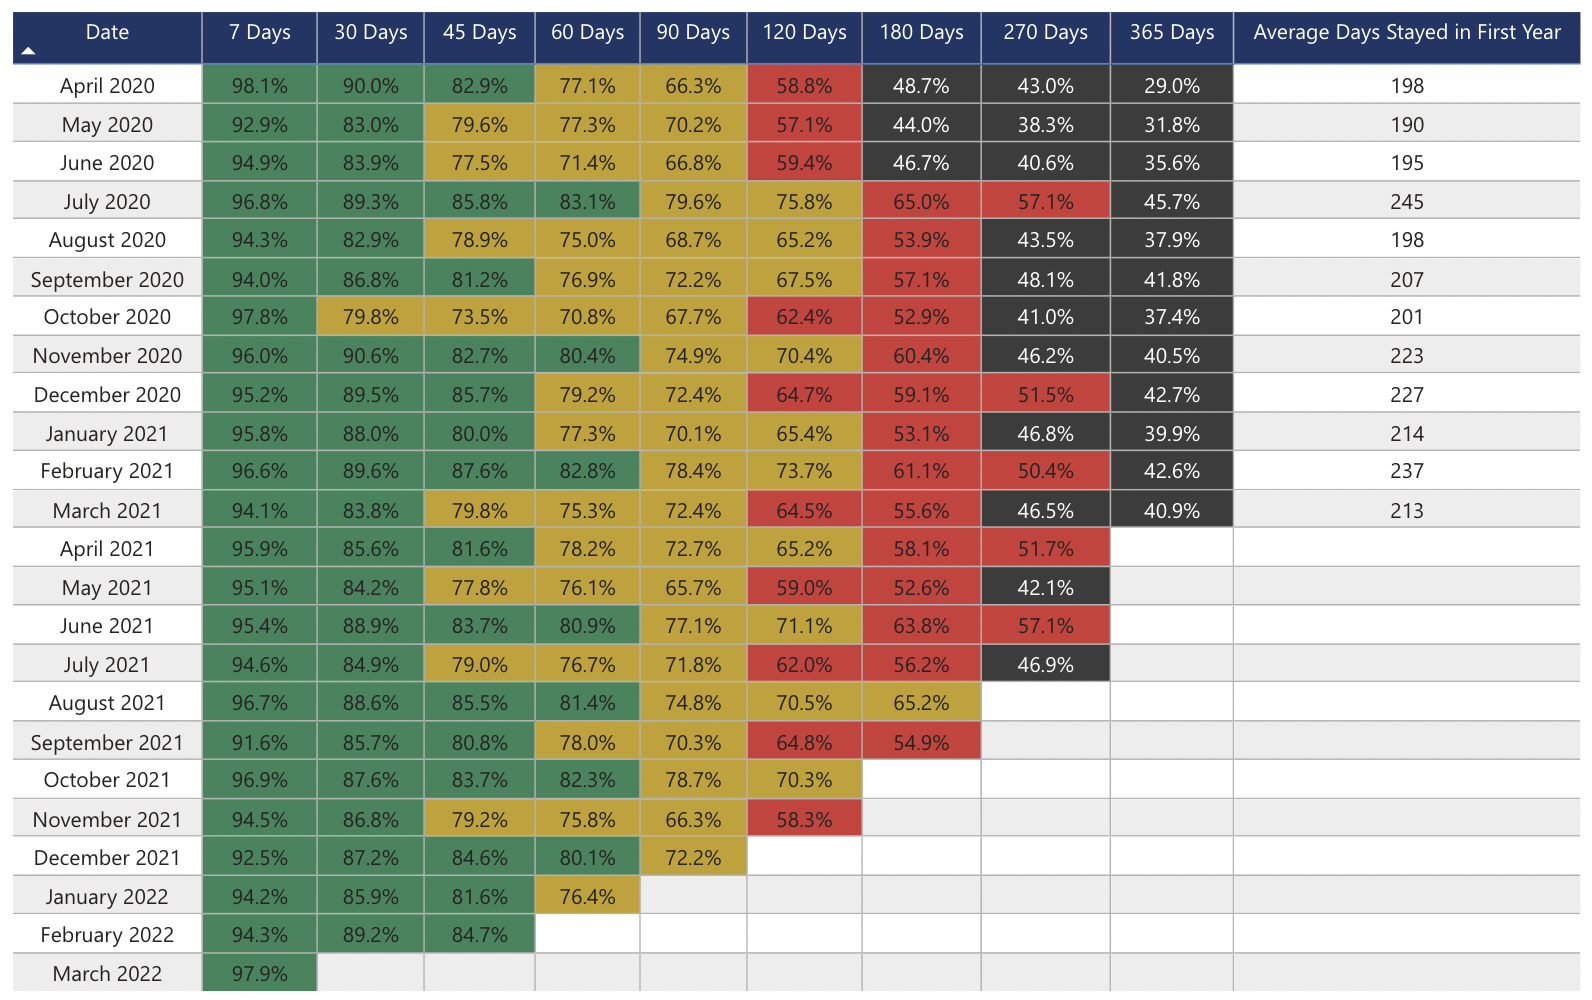 Interestingly, the Stay Days Table does not show a decrease in short-term retention for new-to-you drivers despite the overall decrease in retention rates. Retention rates for new drivers remain steady, suggesting that more tenured drivers are the ones choosing to leave their carriers, either due to retirement, dissatisfaction with the industry, or to switch to another carrier.